
 Posts


Saturday, January 22, 2011
Possible interesting solution to distance to market mystery
I haven't been able to sleep these last two nights for thinking about why distance to market might increase rent (ie has a positive sign in the regression). I posted something about this mystery a few days ago. I think the solution might be connected with perceptions of risk. Farmers who face stable long-term conditions with regard to climate can generally out-bid farmers who are concerned only about the short-term. Folks with deep pockets can wait out the troughs because they aren't so worried about bringing home food to their family every single day. They can store food or buy it. So it is possible that the unusual pattern of a positive sign might be caused by highly variable weather conditions in that location. So I need to go back over metereological records and calculate the coefficients of variation for temperature and rainfall in various parts of the southwest. I'll put the numbers into the regression and see what happens. This is fun!

Track, rent and causality
I have been working on the mathematical model for the relationship between the laying of railway track and changes in rent. A bit of a problem is showing that there is 'causality' between the two. How can we prove that track caused change in rent? The answer is we can't, and the whole area of causality is frankly speaking a philosophical minefield. It is extraordinarily difficult to show that one thing 'causes' another. For our purposes, the only tool we can use is Granger causality which tests the relationship using time. What we want to see is that rent changes AFTER a change in track, not simultaneously or even worse, before. Malcolm has just given me the track for our eighth estate and I have done the Granger test on all of the them. I'm pleased to say that they all scraped through, some only just. I limited the range of years from 1832-1882 which gives us a half-century. We don't have thorough track measurements for the period after 1872, and wheat and cattle prices were highly volatile in the 1880s. That's OK...we've made the point.
I've been using an interesting form of regression, called Vector Auto-Regression or VAR to get out the stats. It is simply beautiful! Life doesn't get better than this!
I've been using an interesting form of regression, called Vector Auto-Regression or VAR to get out the stats. It is simply beautiful! Life doesn't get better than this!
Tuesday, January 18, 2011
Wheat flows within Britain

Calculating net flows is a useful step in analysing the agricultural structure of a country. We could if we wanted expand the scope to include European countries and North America. Here we had to make an assumption that the per capita consumption of wheat (in the form of bread) was the same across counties. There is evidence for and against that assumption.
Monday, January 17, 2011
Malcolm's comment about railway shareholding
Malcolm made an interesting comment on my last post. We were discussing whether the fact that the owner of a large estate invested in railway shares was interesting or not. Malcolm pointed out that the very substantial investment by the Earl of Leicester, owner of the very large Holkham Hall estate, in railway shares, was just prior to the expansion of railway track near his estate. This would indeed be interesting if:
- we could see a pattern, such as other estate owners also making large investments
- we could infer from this that the estate owners knew that they would be able to increase rents as a result of 'extracting' the savings from their tenants. If thus was the case, the estate owners were getting a free ride: their investment in railway shares would be (probably) be profitable AND they trousered the extra rents. Nice work if you can get it!
Friday, January 14, 2011
Connectivity in the railways paper
Some interesting advances today in the railways paper.
1. Malcolm has been calculating the length of track available cumulatively on an annual basis from 1832 within a 40km radius of each of our six estates. So far the regressions of rent against track, controlling for wheat and cattle prices for the period 1832-1899, have been excellent. Today I was writing up the mathematical model for the paper and I am not sure that just length of track is enough. How about if there was a very long track but only one station? Of course that didn't happen, but we need to have a variable that we can prove mathematically. While we'll stick with track lengths for the moment, let's consider other options. We want a measure of connectivity: how easy was it for a farmer to get his cattle on a train? How about number of stations? From this I thought about network theory.....and nodes. I found there is a useful add-in to Excel called NodeXl that will draw a graph of connections and also give us a statistic of how connected a network is. So we could update the network year by year and then use the annual statistics of connectivity as the variables in the regression. We could get names of stations and years when they opened from railway timetables, the famous Bradshaw.
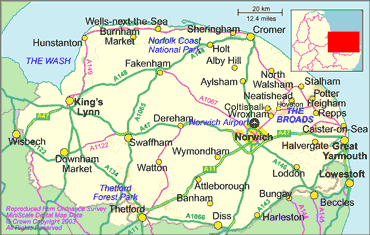
I tried this for Norfolk. Here is the map of modern stations in Norfolk and a bit of the Nodexl output. There is obviously a lot I need to learn about Nodexl but it does have the advantage of having some math theory to back up the output stats.
3. I think I've found somewhere equally interested in Victorian railways, found his blog by chance this morning. Beautifully laid out and all the sources meticulously included.
1. Malcolm has been calculating the length of track available cumulatively on an annual basis from 1832 within a 40km radius of each of our six estates. So far the regressions of rent against track, controlling for wheat and cattle prices for the period 1832-1899, have been excellent. Today I was writing up the mathematical model for the paper and I am not sure that just length of track is enough. How about if there was a very long track but only one station? Of course that didn't happen, but we need to have a variable that we can prove mathematically. While we'll stick with track lengths for the moment, let's consider other options. We want a measure of connectivity: how easy was it for a farmer to get his cattle on a train? How about number of stations? From this I thought about network theory.....and nodes. I found there is a useful add-in to Excel called NodeXl that will draw a graph of connections and also give us a statistic of how connected a network is. So we could update the network year by year and then use the annual statistics of connectivity as the variables in the regression. We could get names of stations and years when they opened from railway timetables, the famous Bradshaw.
I tried this for Norfolk. Here is the map of modern stations in Norfolk and a bit of the Nodexl output. There is obviously a lot I need to learn about Nodexl but it does have the advantage of having some math theory to back up the output stats.
 |
| Nodexl output of some of the map. I got bored before I put in all the stations |
 | ||||
| Modern rail network |
Holkham Hall is close to Fakenham towards the north of the map. When I was a kid we went on family holidays at Hunstanton on the coast to the north-west. And we went on the railways!
2. I was looking for involvement by estate owners in railway companies. Mi found me a book on Holkham Hall and guess what: the Earl of Leicester, the owner of the Holkham Estate, spent a year and a half of the estate's profit in buying railway shares in the 1880s. That was a lot of money. AND he campaigned for a branch line to run near the estate. Mi is getting me more books on this. I'd like to know whether the owners of our other estates also bought railway shares. But is this actually useful data? What do you think? 3. I think I've found somewhere equally interested in Victorian railways, found his blog by chance this morning. Beautifully laid out and all the sources meticulously included.
Thursday, January 13, 2011
Railways paper: six panels up
We now have six 'panels' each representing an estate's rent for the period 1832-1899. That is a total of 337 observations allowing for missing data and the 'instruments' needed to adjust for temporal effects. Malcolm just sent me the track records for the last estate, Badminton....I held my breath while the computer did the work (takes a few minutes). I was blue in the face when the answer came out---still significant! So we have a model that looks like this:

Note the positive sign for track, which means that an increase in railway within 40 km of the estate increases the rent. The effect isn't large, probably because the difference in costs between using the railway and 'droving' the livestock along a road wasn't a large part of the total farm budget. BUT it is statistically significant, and that is what counts.
One of the six estates is Thorndon, pictured here. Think of the heating bill! No wonder they had to raise the rents of all their tenant farmers!
Next I am going to work on a separate regression for Holkham Hall, a big estate in Norfolk for which Mi has been getting me the data. Holkham is one of the six, so we already have some knowledge of this estate. It is in Norfolk, on the east coast, about a hundred miles north of London.

 |
| Family home for the owners of the Thorndon Estate |
One of the six estates is Thorndon, pictured here. Think of the heating bill! No wonder they had to raise the rents of all their tenant farmers!
Next I am going to work on a separate regression for Holkham Hall, a big estate in Norfolk for which Mi has been getting me the data. Holkham is one of the six, so we already have some knowledge of this estate. It is in Norfolk, on the east coast, about a hundred miles north of London.
Soils

Just from a glance at the map you can see that most of our parishes lie on fairly sandy soil (2) while those to the north-east lie on more clayey soil. Usually clayey soil is better for arable. It will be interesting to test this.
You'll see that there is a gap in the extreme south-west. That is the county of Cornwall, which I wasn't originally going to include. But it looks as though the thesis of 'market integration' is going to be something we'll run with, so Malcolm is working on that data now. That will bring our total number of observations to nearly eight hundred.
Subscribe to:
Posts (Atom)

